Generate a simple codebook in R
Overview
A key task in empirical projects is to document the structure and content of datasets. This is often done in form of a codebook, a file that lists at least the names of the variables (items) and their content. Sometimes it also describes the variables’ scale level (e.g., interval, ordinal, categorical) and answer options (e.g., 1 = strongly disagree, 5 = strongly agree; not covered here).
Most researchers probably have some form of a codebook when they start designing their study and it might not be necessary to create one. However, at times the initial items are more a sketch and the contents are revised when creating the study or when implementing feedback from pretesters. Researchers can either track and transfer such changes to the provisional version of the codebook or they can create a new codebook based on their dataset. This post demonstrates how to do the latter in R: to create a simple codebook containing item names, labels, and some descriptive statistics. A strength of this approach is that it is less error prone than updating existing codebooks (assuming the necessary information is saved in the dataframe).
But before you go through the trouble of reading this post, note that there’s also an automatic way to generate codebooks that doesn’t require any programming: https://codebook.formr.org. This should work for various file types (.sav (SPSS), .dta (Stata), .rds (R), .rdata (R), .por, .xpt, .csv, .tsv, .csv2).
Load the data and examine item labels
Let’s first load and examine a sample dataset:
library(haven) # package to read files from popular statistical software packages such as SPSS, SAS, Stata
data <- read_sav("https://mmi.psycho.unibas.ch/r-toolbox/data/Cars.sav") # import data
library(sjlabelled) # package to read and write item labels and values
get_label(data) # show content of variables (what the variable measures)
# which returns for example:
# MPG
# "Miles per Gallon"
get_labels(data) # show value labels (what the different answer options mean)
# note: the value labels are not used for this very simple codebook.
# which returns for example:
# $CYLINDER
# [1] "3 Cylinders" "4 Cylinders" "5 Cylinders" "6 Cylinders" "8 Cylinders"Note that the functions get_label and get_labels will only return something if the data are labelled. If your dataset doesn’t contain any item / value labels, you can add them manually using the package sjlabelled (see here). See also my post about cleaning labelled data from Qualtrics.
Extract item labels
The next steps consists in extracting the item labels, item names, and saving them in a new data frame (here a tibble, could also be a different format):
# extract labels from dataframe and store as new object
library(tibble)
simple_codebook <- enframe(get_label(data))

# use more informative column names
colnames(simple_codebook) <- c("variable_id", "item_text")

# Show the new data frame
simple_codebook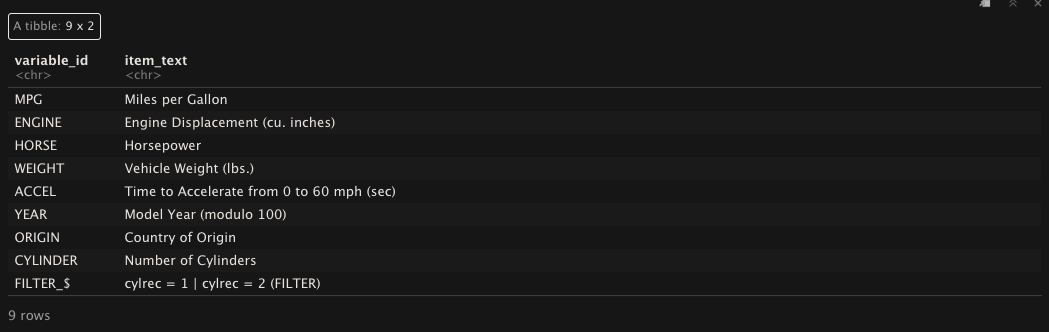
Figure 1. Simple codebook with name and content of variables.
Add some statistics
One more thing that is very helpful to include is the range of the answer options. These and other useful stats can quickly be computed using the function describe from the package psych:
# get descriptive statistics and select those of interest
library(psych)
library(dplyr)
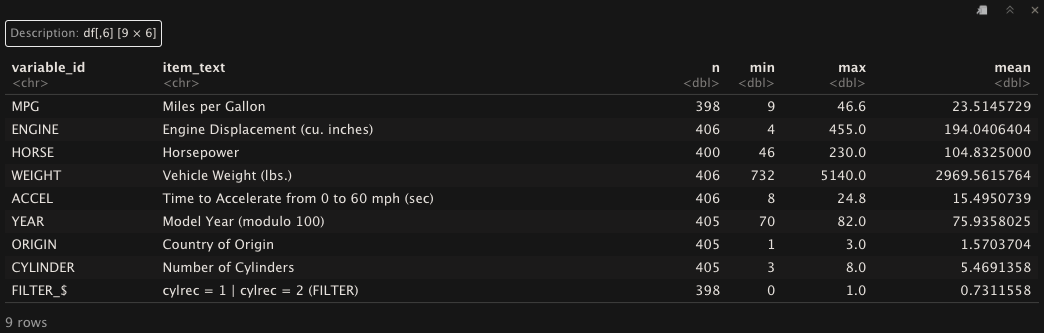
descriptives <- data %>% describe() %>% as_tibble() %>% select("n","min","max","mean")
# add stats to codebook
simple_codebook <- cbind(simple_codebook,descriptives)Et voilà, the simple codebook:
Save codebook as .csv or .xlsx
Finally, it is helpful to save the codebook in a file that can easily be shared and accessed.
# write to csv and Excel
write.csv(simple_codebook,file="simple_codebook.csv", na="", row.names=FALSE)

library(openxlsx)
write.xlsx(simple_codebook,file="simple_codebook.xlsx")
More sophisticated alternative
If you’re interested in a more sophisticated codebook that includes more information, there’s a great package called codebook (see here and here). This works particularly well when the data have been collected with formr (see here). However, there are some caveats: First, to the best of my knowledge you can only use this package if you have installed R Markdown and the necessary additional software to create PDF documents from within R Markdown. Second, in my own experience there are often variables that cause problems when generating a codebook using codebook, which means that you need to spend some time to identify problematic variables and find a way to deal with them. Third, it isn’t possible to programmatically create .csv or .xlsx files. To achieve this, you need to click your way through a menu.