Automating reports with R Markdown is easier and more useful than you may think!
Overview
Creating customized reports in which placeholders are replaced with values from a dataset can be very useful. Achieving this can be quite easy with R Markdown but it is hard to find a good tutorial. Here I briefly describe some use cases and explain the basic procedure to create such reports by using parameterized reports and R Markdown.
Introduction
There are many situations in which you have a database and it would be useful to automatically create customized documents in which some of the content changes according to the information in the database. A very simple example may be personalized letters based on a digital address book. Or maybe you are a teacher and you want to give your students a customized feedback on how they performed on different tasks. Or maybe you promised study participants a feedback and you want to show them their score in relation to others, as we did recently (see Figure 1).
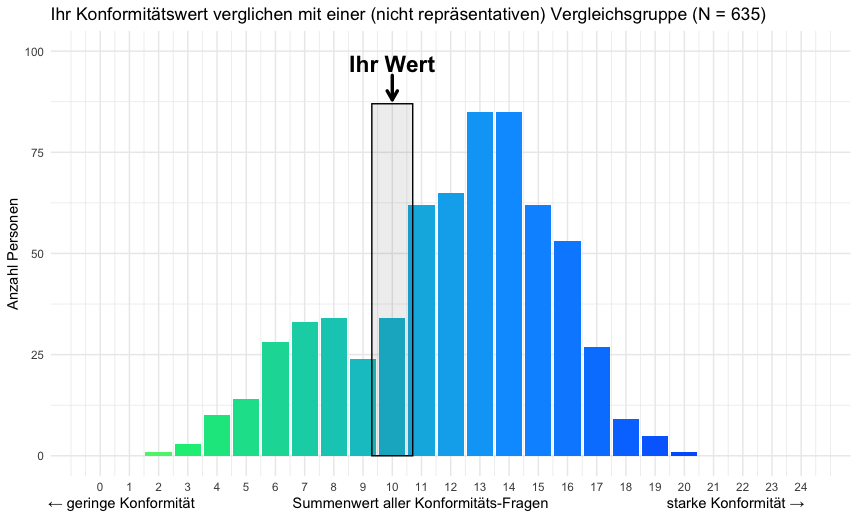
Figure 1. A customized feedback figure.
I was recently looking for a solution to prepare automated summary reports on how stringently articles submitted to our journal Global Environmental Psychology adhere to open science practices.
It turns out that R Markdown is an incredibly powerful and a relatively easy tool to create highly customized reports. For example, you can hide whole sections that are irrelevant (e.g., questions about open data when the submitted work is a theoretical article). With a bit of tweaking, you can even do things such as highlighting problematic entries in tables (Figure 2).
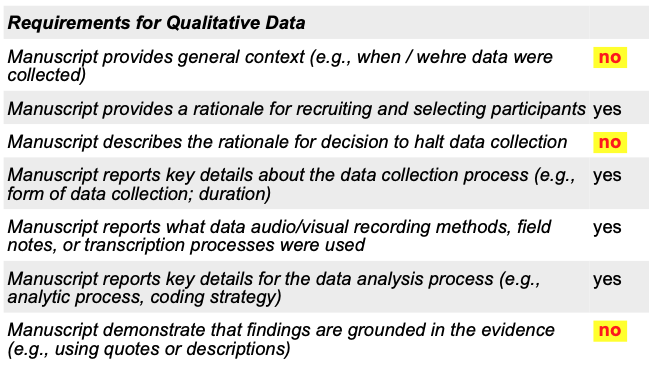
Figure 2. Problematic answers are automatically highlighted in red on yellow background.
If you want to see how the customized reports for our journal look like, see example 1, example 2, and example 3 (all fictitious article submissions).
How to create customized reports
When using existing data as a starting point, you need two files:
A R Markdown template (“.Rmd”). This defines the layout of the report, the parts that are identical, and the placeholders that will differ as a function of the underlying data. The placeholders are called “params”. They must be defined in the yaml section (e.g.,
params: article_type) at the top of the file and can then be “accessed” in the body of the document (e.g.,params$article_type). You can download the template that I used here.A separate R file that sends the relevant data to the template and saves a distinct document for each case (i.e., row / participant). The code to pass the data to the template and create the reports is here (you should save it as .Rmd though).
Things you need and further resources
Note that a couple of things need to be installed on your computer to be able to create pdf documents in this manner:
- R
- pandoc
- packages: rmarkdown, knitr, …
For other examples and helpful resources, see The Epidemiologist R Handbook, towardsdatascience, or datalorax.